
An Introduction To Forex Charts

No discussion of technical analysis would be complete without an introduction to Forex chart basics. The very first Forex chart we will start with is called a “bar” chart. It gets its name because of its elongated bar-like shape. The typical bar on a bar chart is composed of 4 components:
Open – Opening price of the time period used
High – Highest price of the time period used
Low – Lowest price of the time period used
Close – Last price of the time period used
Below is a typical bar of a bar chart
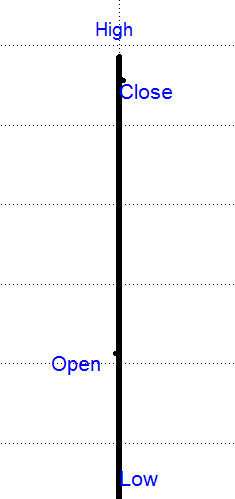
Figure 1.1 Bar
Open – Tick on left side of bar
High – Top of bar
Low – Bottom of bar
Close – Tick on Last price of the time period used
The chart below is a monthly chart of the EURUSD (Eurodollar/US Dollar) currency pair.
Monthly charts are longer-term charts used to get a feel for the “big picture” of the market. Many traders start here and then work their way through a series of smaller timeframe charts.
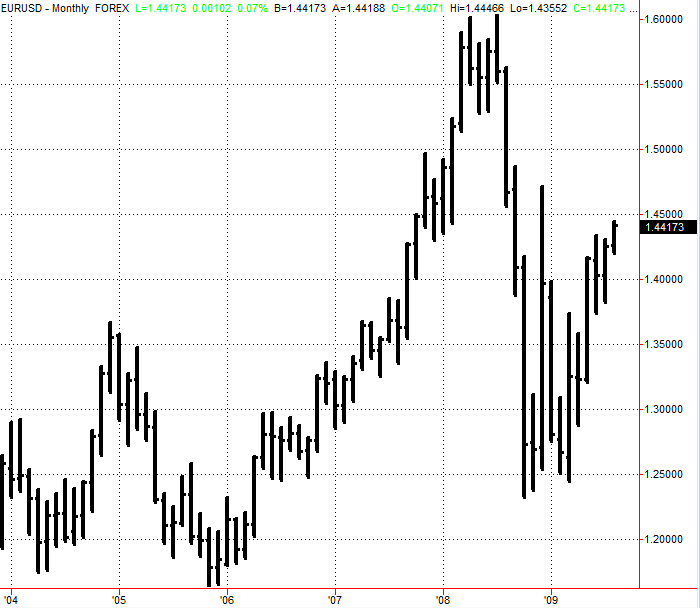
Figure 1.2 Monthly EURUSD Data
The weekly chart is the next timeframe available. The weekly chart confirms the EURUSD’s upward movement since the beginning of 2009.
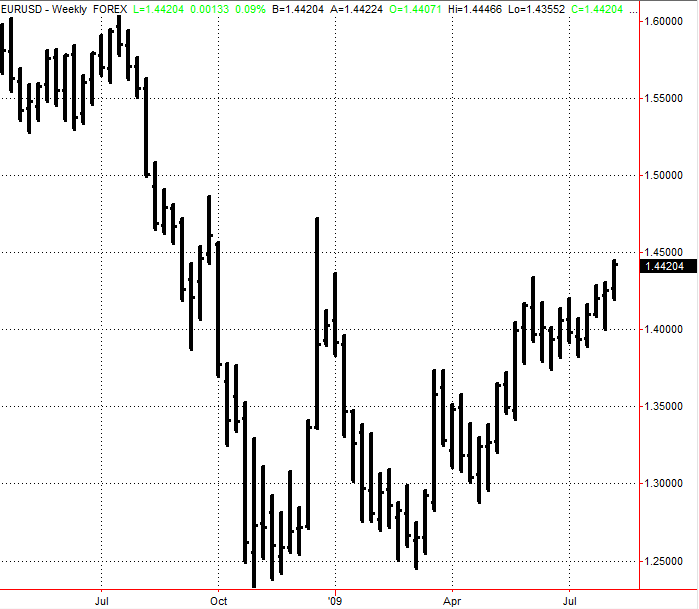
Figure 1.3 Weekly EURUSD Data
When we focus in on the daily chart we see that the market continues to be in an uptrend.
Traders who are trend followers often take this “top down” approach to gain perspective on the market’s movements and establish the direction of the trend.
If a trader using this method feels that the upward trend will continue they will see to find a suitable entry point for a long position in this market.
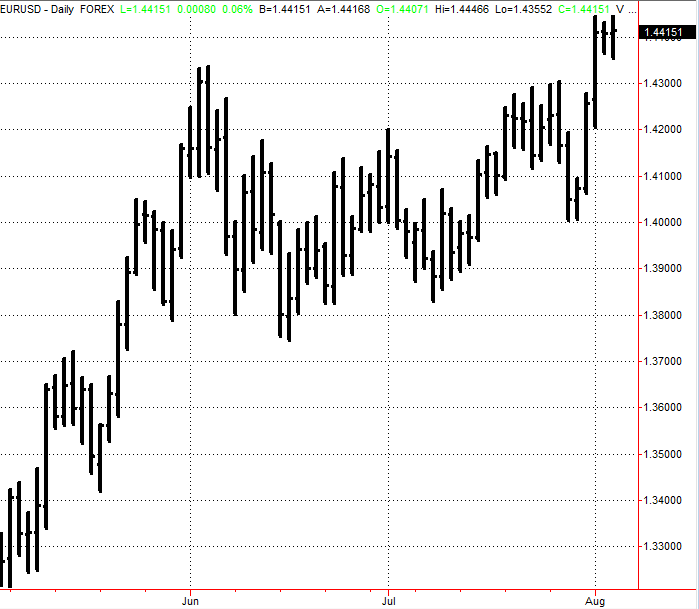
Figure 1.4 Daily EURUSD Data
Below is a very popular timeframe to use in Forex charting. It is a 4-hour bar chart. The 4-hour chart is an excellent chart to use in trading.
It has become increasingly popular with those traders who feel that the smaller timeframes, i.e., 15 minute, 5 minute, etc. move too erratically to base trading decisions on.
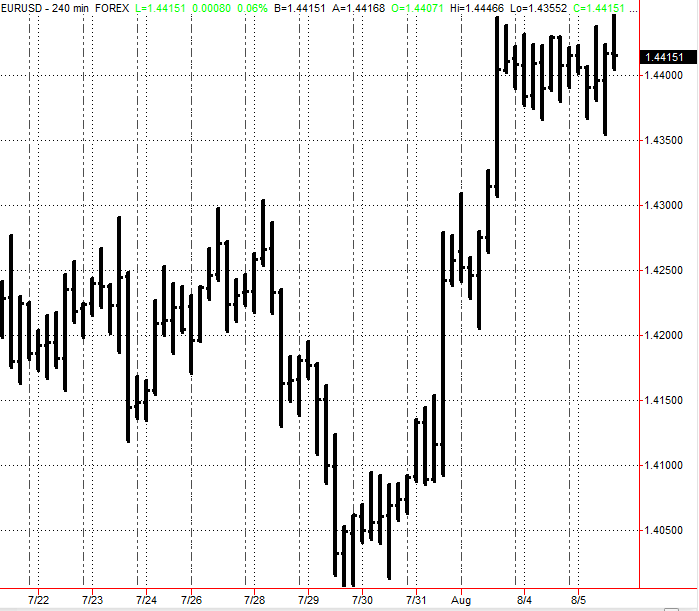
Figure 1.5 4-Hour EURUSD Data
The hourly chart is by far one of the most popular. It may be used by longer-term traders to refine their entries and exits. The 1-hour chart is also used by day traders who wish to gauge short-term market direction.
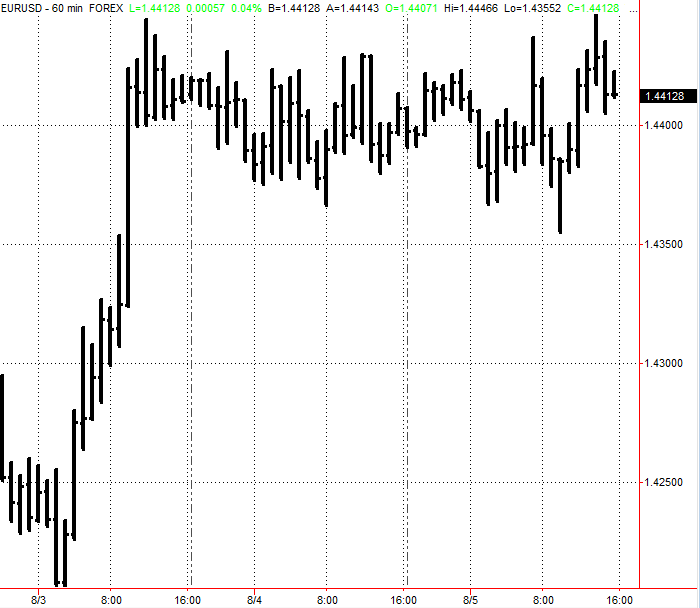
Figure 1.6 1-Hour EURUSD Data
The 5-minute chart is used almost exclusively by day traders.
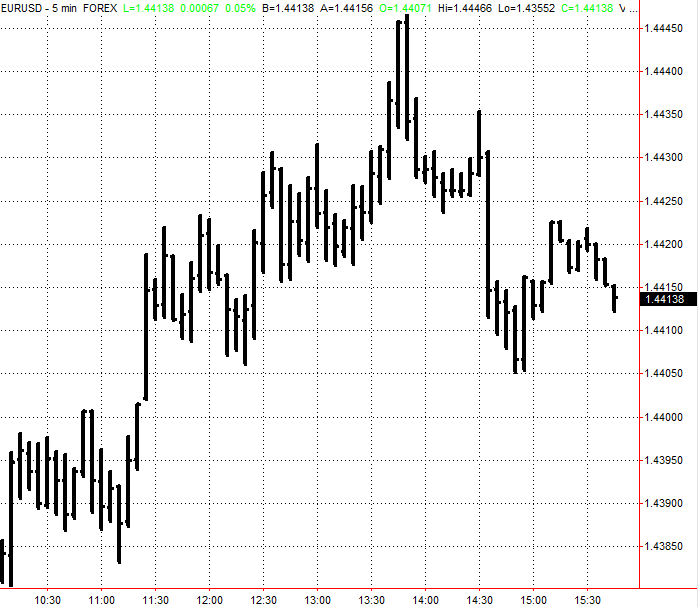
Figure 1.7 5-Minute EURUSD Data
Another form of Forex chart is the candlestick chart. Candlestick charting originated in Japan and is one of the oldest methods of charting in the world.
Candlestick charting has enjoyed increased popularity and is now used by more Forex traders than ever.
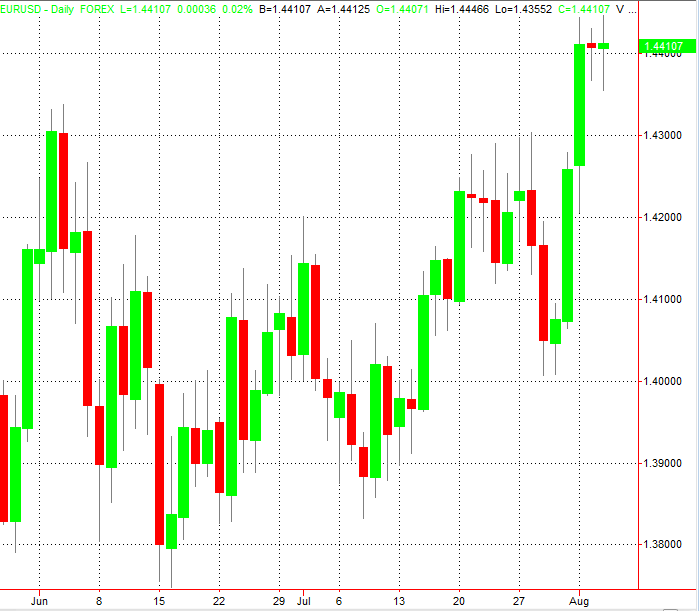
Figure 1.8 Daily EURUSD Candlestick Data
The name “candlesticks” comes from the appearance of the data on the chart. They price data looks like a “candle” with a “wick” on each end. In the chart above the solid green and solid read areas are known as the “real bodies”.
The gray lines that are extending from each end are known as “wicks”. You may also here “wicks” referred to as “shadows”
Candlesticks have become so popular because you can look at a candlestick chart and instantly get useful information. For instance, the green candles are called “bullish candles” because the price moved in an upward direction.
The closing price for a green candle is always higher than the opening price. Red candles are called “bearish candles” because the price moved in a downward direction. The closing price for a red candle is always lower than the opening price.
The chart below shows a green candle at the start of a strong uptrend (see blue arrow).
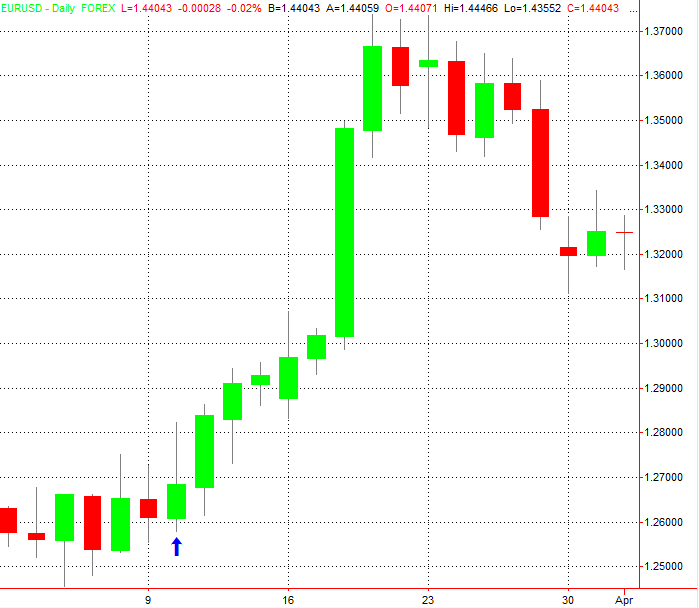
Figure 1.9 Daily EURUSD Candlestick Data
The chart below shows a red candle at the start of a strong downtrend (see red arrow).
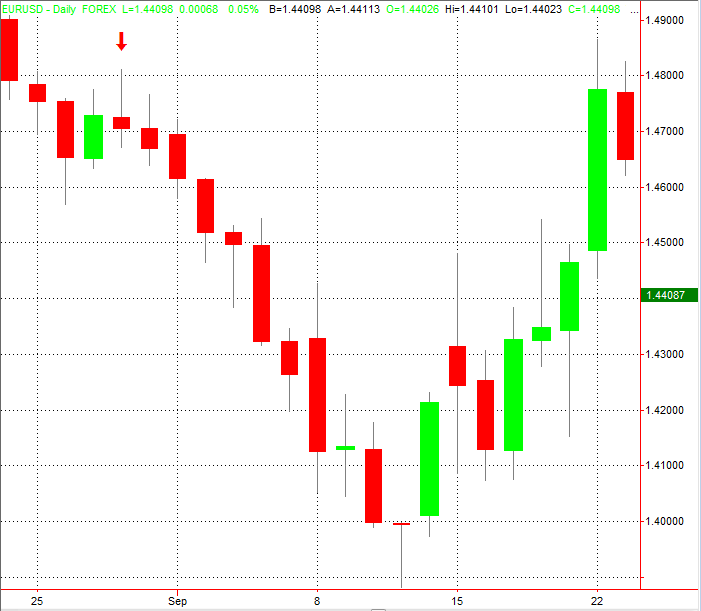
Figure 1.10 Daily EURUSD Candlestick Data
Consecutive candles of the same color generally indicate the continuation of a trend.
You can see from this brief introduction to candlestick charts that they can be very useful. After our brief introduction to candlestick charts it’s time to move to our next topic.

Forex Charts and Forex Technical Indicators
Forex charts and technical indicators, also known simply as “indicators” have become a standard of Forex market analysis. An indicator is a visual element that is placed on the same Forex chart as the currency pair.
It gets its name because it “indicates” something. An indicator can tell a trader when prices are at a favorable level to place a trade such as a buy trade or a sell trade.
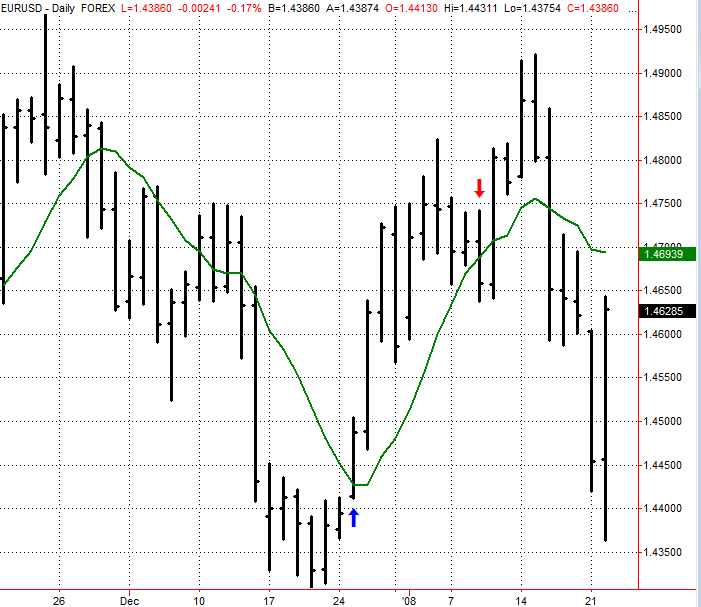
Figure 1.11 Daily EURUSD Data
The green line we see below is an example of an indicator. This particular indicator is called a “simple moving average” or SMA. Arrows have been placed on the chart to represent buy and sell triggers. The “triggers” in this case are as follows:
When the price closes above the moving average then we have a buy trigger.
When the price closes below the moving average we have a sell trigger.

Figure 1.12 Daily EURUSD Data
One question you may ask is, “When we see a trigger what do we do?” That’s a good question. The standard way of using a moving average is to take the trade on the next bar after the trigger. This means that we would buy on the open of the bar “after” the trigger bar (blue up arrow bar in this case). The reverse is true of selling.
This is a simple example how you can use a simple Forex indicator to make a trading decision. Notice that this is just an observation and that in order to profit in Forex you will need to analyze the market further.

Why analyze a market?
You need to analyze a market in order to make a decision to buy or sell…or do nothing at all. Let’s further explore how Forex technical indicators can be used to help us make trading decisions.
In fact, we are going to look at how technical indicators can be used to create simple Forex trading systems.
Simply put, a Forex trading system is a set of rules designed to help you trade Forex profitably. A Forex system generates trading signals. These trading signals tell the trader to take a certain action such as BUY or SELL.
The moving average we are using is a 9-period moving average. Since we are working with daily data this we will be using a 9-day moving average.
Date Open High Low Close Avg.
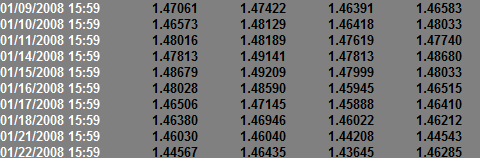
Table 1.1 Daily EURUSD Raw Data with Simple Moving Average
The table above shows the open, high, low, and close prices with the moving average values in green. As you can see the values of the moving averages changes as the prices of the EURUSD changes,. It “moves” as the price moves, hence the name moving averages.
This particular moving average is calculated using the last 9 “closing” prices (listed under Close in the table).
Below is a daily EURUSD chart showing the buy and sell signals generated by using a simple 9-period moving average trading system we created.
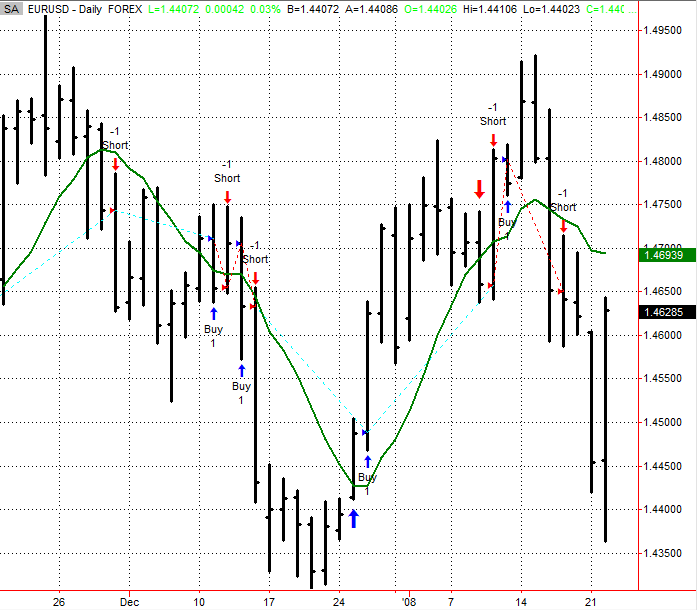
Figure 1.13 Daily EURUSD Data with Simple Moving Average
One of the greatest advantages of using trading systems is to see how they would have performed on past data. If the results on past data look favorable then we may have a system that will work on future data as well. So how did our 9 period moving average system perform? Let’s take a look:
Test Period: 1/20/2003-1/20/2008
Stop Loss Amount = $1000 (100pips)
We have added a risk control measure in the form of a stop loss. A stop loss is an order designed to “stop loss” on a trading position. If the market moves in a way that causes your position to lose value the stop loss is designed to limit the amount of that loss.
10 Day Simple Moving Average System Net Profit = ~ – $2,300
So far this doesn’t seem to be the type of moving average system that we would like to trade. Fortunately for us we can change the parameters of this indicator and research to find one which best suits our needs.
We have run a few tests and found the following:
42 Day Simple Moving Average System Net Profit = ~ $23,000
That’s quite a difference in net profit isn’t it? As you can see from this simple example it pays to do your research to find indicator settings that work well.
Note: The above examples and all examples that follow are for the purposes of illustration only. They are not meant to suggest that the displayed settings are to be used.
Introducing The Stochastic Oscillator
The next indicator we will explore is called the stochastic oscillator or stochastics for short. Unlike the simple moving average the stochastic oscillator is not displayed on the same scale as the price. It is typically displayed below the prices as shown below.
The stochastic oscillator is grouped within type of technical indicators called oscillators because its value move or oscillate between two extremes. These extremes range between 0-100.
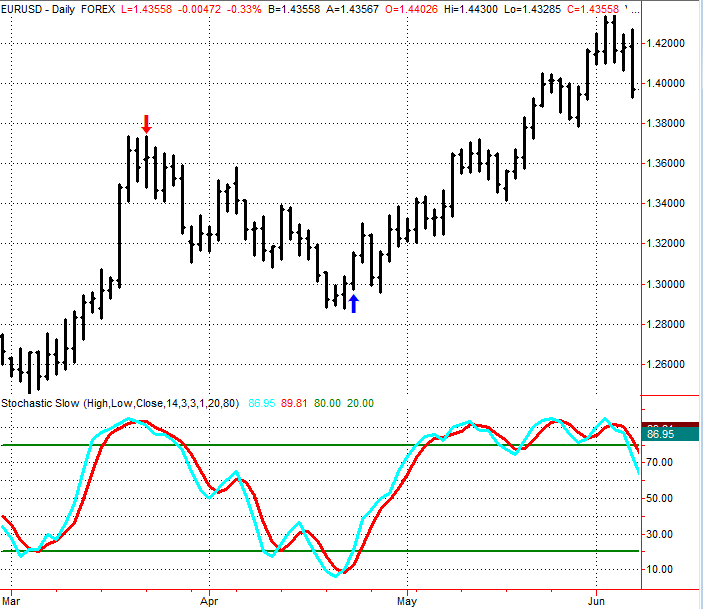
Figure 1.14 Daily EURUSD Data with 14-period Stochastic
The typical interpretation of the stochastic oscillator is as follows:
– When the stochastic is over 80 that indicates that the market is overbought and losing upward momentum. Traders can either look to liquidate their long (buy) positions or look to sell.
– When the stochastic is below 20 that indicates that the market is oversold and losing downward momentum. Traders can either look to liquidate their short (sell) positions or look to buy.
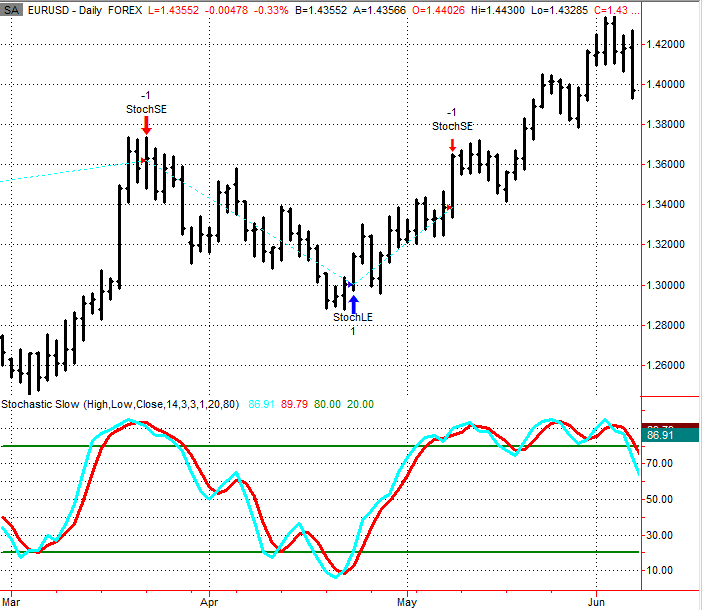
Figure 1.15 Daily EURUSD Data
The above chart shows entries and exits based upon using a 14-day stochastic oscillator.
Test Period: 1/20/2003-1/20/2008
Stop Loss Amount = $1000 (100pips)
14 Day Stochastic Oscillator System Net Profit = ~ – $1,900
So far this doesn’t seem to be the type of system that we would like to trade.
We have run a few tests and found the following:
6 Day and 46 Day Stochastic Oscillator System Net Profit = ~ $22,000
That’s quite a difference in net profit isn’t it? In this example you are shown two different parameters for the stochastic oscillator to introduce you to a new concept. In the first test we used a single parameter for both the buy and the sell trades. In the second test we used 6 days for our buy entries and 46 days for our sell entries.
Why does this seem to work so well? Because market may behave differently when moving downward than they do when moving upward so the best parameters for a bull market will not necessarily be the best parameters for a bear market.
Note: The above examples and all examples that follow are for the purposes of illustration only. They are not meant to suggest that the displayed settings are to be used.
An Introduction To Trading Forex Without Indicators
You have probably heard about trading Forex without indicators. There is much being written about it these days, but it is actually nothing new. Trading without indicators is also called trading “price action”. This means simply trading based upon the price itself and nothing else.
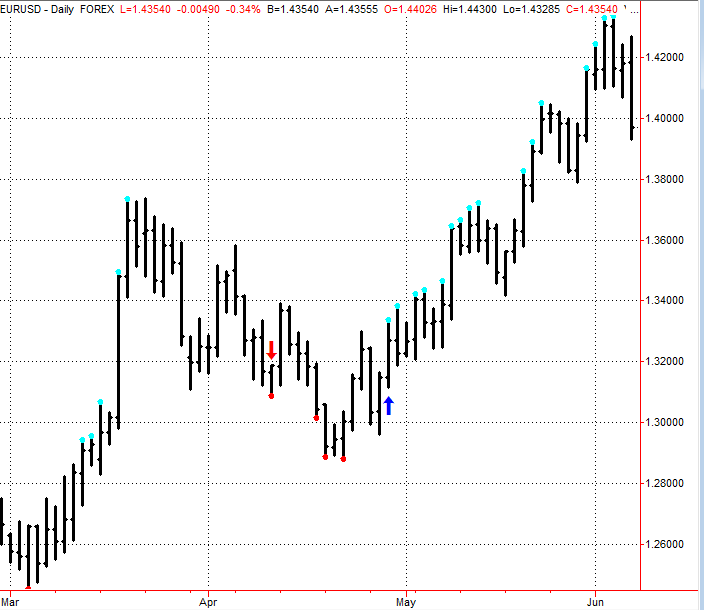
Figure 1.16 Daily EURUSD Data
What follows will be an example of trading without indicators. In the chart above you will see series of blue dots on prices bars and red dots on price bars. Although this is an example of trading without indicators the dots will help with the explanation.
The blue dots represent when the high price has moved higher than the highest high of the previous 10 days.
The red dots represent when a day’s low price has moved lower than the lowest low of the previous 10 days. The red and blue arrows represent a sell (short) entry and a buy (long) entry respectively.
The chart below shows entries and exits based upon using a 10-day breakout system. The system is called a breakout system because the trade is taken when the price “breaks out” of a certain range. In this case we buy on a breakout of the highest high of the last 10 days and sell on a breakout of the lowest low of the last 10 days.
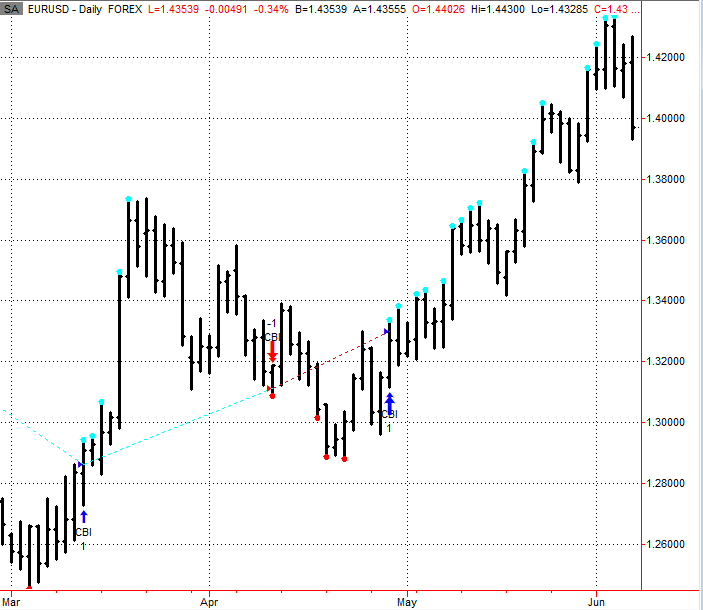
Figure 1.17 Daily EURUSD Data
Test Period: 1/20/2003-1/20/2008
Stop Loss Amount = $1000 (100pips)
14 Day and 8 Day Breakout System Net Profit = ~ $36,000
This is another system where we have used different parameters for the buy entry and the sell entry.
We have run a few tests and found the following:
22 Day and 8 Day Breakout System Net Profit = ~ $42,000
Once again we see that testing different parameters pays off.
We have just gone over a few examples of how we can use a simple Forex chart with or without indicators to create a basic trading system. As we have stated before the parameters in the examples are not meant to be recommendations or suggestions for entering and exiting trades. They are here to illustrate the power that a few simple changes can have on a trading system’s overall performance results.

Determining Your Strategy
It takes successful traders a while to develop and perfect the strategies that they use. Some prefer to use one particular study or formula while others use a variety of other strategies.
Some experts would probably recommend that you try to find a good combination of both fundamental and technical analysis to make long-term predictions and to help you identify entry and exit points. Ultimately the decision is up to you.
It is also recommended that when you start in the FOREX market you should start by opening a demo account and paper trade as a way to practice making a profit on a regular basis.
Usually individuals who get into the FOREX market too quickly and without practicing to gain experience tend to lose money and ultimately aren’t successful. So before investing your money into anything, it’s always a good idea to get your feet wet before jumping in.
You will also have to learn to trade while keeping your emotions in check. It would be impossible to track the stop-loss points if you aren’t able to execute them when you need to.
It is highly recommended that you set your stop-loss and take-profit points to execute automatically and never change them unless it’s a necessity. Trust your decisions and stand by them or you will end up driving you and your broker crazy.
It’s also important to follow the trends. Going against a trend is a pretty big gamble because statistically the FOREX market has tended to stick to trends so odds are you will be more successful if you don’t go against the grain.
The FOREX market is the world’s biggest market and people are drawn to it on a daily basis. But before you jump into the market, make sure you have a broker you trust and really put some effort into finding a strategy that will help you be successful.
A Basic Introduction To Forex Charts